


کارگروه زبان انگلیسی انجمن اقتصاد شهید بهشتی
TGlist rating
0
0
TypePublic
Verification
Not verifiedTrust
Not trustedLocation
LanguageOther
Channel creation dateMar 04, 2025
Added to TGlist
Apr 29, 2025Records
17.05.202523:59
278Subscribers27.03.202523:59
0Citation index13.04.202523:59
389Average views per post13.04.202523:59
389Average views per ad post05.05.202513:58
19.05%ER06.05.202514:56
120.61%ERR

17.05.202517:34
The Essential Adam Smith: The Role of Government
More info: essentialadamsmith.org
Subtitles and Edits by:
- Sheyda Fazeli
#EconVids
@ELWG_EcoSbu
More info: essentialadamsmith.org
Subtitles and Edits by:
- Sheyda Fazeli
#EconVids
@ELWG_EcoSbu


15.05.202517:33
People in richer countries spend more on food, but it’s a smaller share of their overall spending
The scatter plot in the image highlights this trend clearly: as the annual amount spent on food (shown on the x-axis) increases, the share of total spending allocated to food (on the y-axis) generally decreases.
The chart confirms that people in richer countries spend more on food overall, but it makes up a smaller share of their total spending. For instance, although food accounted for less than 10% of Swiss consumer spending, compared to nearly 60% in Kenya, the average Swiss food budget was more than four times that of Kenya. This pattern, visible across countries' data, reflects that people in low- to middle-income countries have less money to spend on food and often cannot afford a healthy diet.
- By Parnian Sefat
#EconAnalysis
@ELWG_EcoSbu


12.05.202517:30
Escalation (n)
#EconWords
@ELWG_EcoSbu
#EconWords
@ELWG_EcoSbu

08.05.202517:34
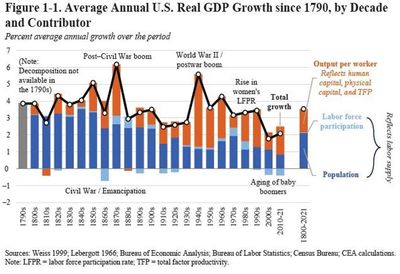
A Long-Run Perspective on US Economic Growth
This chart shows average annual U.S. real GDP growth by decade from the 1790s to 2021, broken down by population growth, labor force participation, and output per worker. Total GDP growth is marked by white dots. Key events like the Civil War, WWII, and the postwar boom caused notable shifts. Growth peaked in the 1940s but has declined since the 1960s.
Over time, population and labor force participation have contributed less to growth, especially since the 2000s. In contrast, output per worker—driven by productivity—has become more important. The rise in women’s labor force participation boosted growth in the 1970s–80s, but aging populations since 2000 have made productivity gains the main driver.
- By Zeinab Sajjadi
#EconAnalysis
@ELWG_EcoSbu


09.05.202518:04
#EconTweets
@ELWG_EcoSbu
@ELWG_EcoSbu


05.05.202517:33
In this video from the Econimate channel on YouTube, the consequences of giving workers more administrative authority are explored. This video is based on the paper “Labor in the Boardroom” (click to see the paper), which explores the effects of this change in a sample from Germany on the firm's investment as well as other factors. The paper concludes that the effects are quite the opposite of the common beliefs.
You can see the abstract below as well.
You can see the abstract below as well.

14.05.202518:01
#EconClassics
@ELWG_EcoSbu
@ELWG_EcoSbu
Log in to unlock more functionality.